Trends in Nitrate Concentrations in Public Water-Supply Wells, Suffolk County, New York, 1982-2008
|
|
|---|
Introduction
High nitrate concentrations are a common concern among many purveyors, including the Suffolk County Water Authority (SCWA), the largest supplier of water to residents in Suffolk County. Typically, the amount of nitrate in groundwater is related to land use, where the greatest concentrations are observed in agricultural regions. In many areas, the nitrate concentration has increased steadily in recent years, even in areas that are no longer farmed and are now sewered. A statistical analysis for trends of over 20 years in nitrate concentration data from SCWA wells is needed to determine the susceptibility of supply-wells to exceed the Maximum Contaminant Level (MCL) for nitrate. This information is essential for making informed planning decisions about the sustainability of ground-water resources for public supply. The primary objective of this project is to evaluate trends in nitrate at supply wells within the SCWA network.
Approach
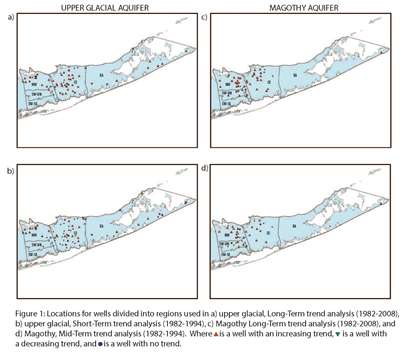
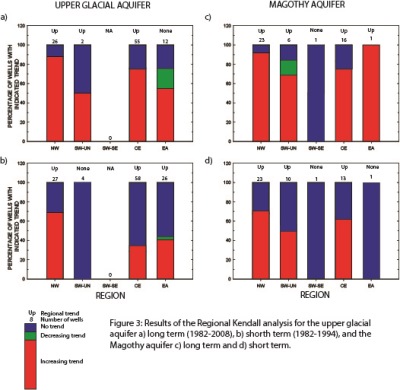
Nitrate concentrations in groundwater from public-supply wells of the Suffolk County Water Authority (SCWA) for which suitable and sufficient data exist from 1982 to 2008 were analyzed using the Mann-Kendall test for trends in ESTREND (Schertz and others, 1991). The Mann-Kendall test identifies trends without removing variations in nitrate concentrations due to factors other than time. Separate trend analyses were completed on wells screened in the upper glacial and the Magothy aquifers. Two time periods were identified as having suitable data for analysis using the Mann-Kendall test: Long-Term (1982-2008) and Short-Term (1982-1994). The Regional-Kendall test for trends was used to assess regional patterns in nitrate concentrations (Helsel and Frans, 2006; Sprague and Lorenz, 2009). The Regional-Kendall test for trend assess whether a consistent trend occurs at many of the sampling locations within a region (Helsel and Frans, 2006). Five Regions, based on sewerage, land use (including population density), and hydrogeologic factors were identified for the Regional-Kendall test: Northwest (NW), Southwest Unsewered (SW-UN), Southwest Sewered (SW-SE), Central (CE), and Eastern (EA) Regions (figure 1). Previous studies in Suffolk and Nassau Counties have used a similar approach to distinguish regional differences in groundwater quality, including nitrate (Leamond and others, 1992; Stackelberg, 1995; and Pearsall, 1996).Nitrate data collected from more than 700 public water-supply wells over the last 50 years were assessed for suitability for inclusion in the trends analysis. For each time period, at least one nitrate data result was available in the first and last year. Data were screened to ensure that all wells included met the requirement for the statistical test. The minimum number of detections required is ten; any wells with less than ten were not included in the analysis. For wells with less than five percent censoring (concentrations reported as less than the method reporting limit [MRL]), the uncensored Mann-Kendall analysis was used, otherwise the censored Mann-Kendall was used. Of the 700 wells, 264 wells (95 in the Magothy aquifer, 169 in the upper glacial aquifer) were sufficient to assess one or more of the two time periods.
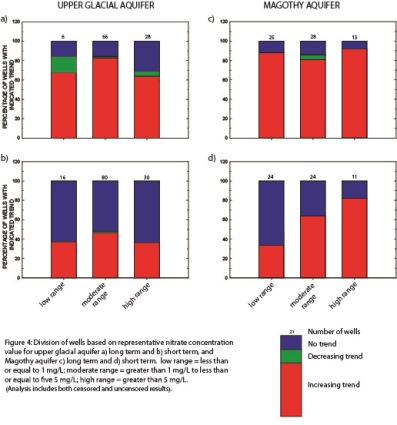
Statistical trends were evaluated for each well individually for each time period based on the representative value for nitrate concentration. (A trend was considered statistically significant at p=0.05.) The representative value is the median of the data used in the trend test. The representative value is assumed to represent a concentration for typical conditions in the middle of the trend test period. Wells were classified by concentration using the representative value. Concentrations were divided into three classes: less than or equal to 1 milligram per liter (mg/L) (low range), greater than 1 mg/ L and less than or equal to 5 mg/L (moderate range), and greater than 5 mg/L (high range).
Summary of Analysis
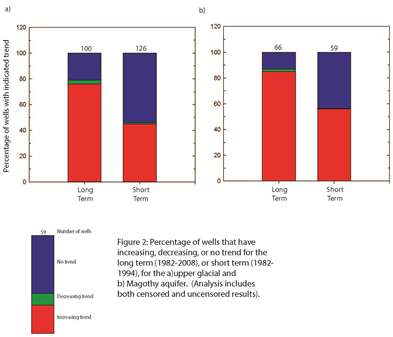
Analysis of available nitrate data for public water-supply wells in Suffolk County, New York, over the period 1982-2008 shows statistically significant increases in nitrate concentration during this period. The long-term analysis (1982-2008) for both the Magothy and upper glacial aquifer shows the greatest number of wells with increasing nitrate trends in comparison to the other time periods (figure 2). In each time period for either aquifer, the majority of wells with significant trends in nitrate show increasing trends, while few wells have decreasing nitrate trends. The Magothy aquifer has more wells reporting increasing trends than the upper glacial aquifer. Fewer than 15% of wells have decreasing trends in either period or aquifer. Two regions, NW and CE, had a regional increasing trend in nitrate for each aquifer and time period (figures 1 and 3 ). There were no regional decreasing trends in nitrate concentrations for any of the analyses (aquifer and time period). Most of the representative concentration values for each of the wells are in the high range (greater than 5 mg/L); the greatest portion of wells with an increasing trend in this range was reported for the Magothy long term analysis (92%) (figure 4 ).
Future analysis of this dataset may include the percent of change in nitrate concentration for the time period. This type of analysis can distinguish which wells (and regions) are experiencing the greatest rate of increase over a time period. This analysis may be useful for determining where future increasing trends in nitrate concentration will occur if water-use management practices continue as they are currently implemented. Additional questions could be addressed by completing a statistical analysis on well pumpage data over the same time frame. The pumpage analysis can be used as a tool to determine the effect water-use management has had on nitrate trends over time periods. The pumpage analysis may also provide insight into how better water-use management can be implemented to control nitrate trends over a long time period and seasonally.
Fisher, I.J. and Phillips, P.J., 2014, Trends in nitrate concentrations in Suffolk County Water Authority public supply wells, NewYork, 1982-2008 (abstract), 21st Conference on Geology of Long Island and Metropolitan New York, April 12, 2014, Stony Brook, NY
-
Related Links
-
References
For additional information contact:
(1) Director
U.S. Geological Survey
Troy Program Office
New York Water Science Center
425 Jordan Road
Troy, NY 12180
(518)285-5600
http://ny.water.usgs.gov
Part or all of this report is presented in Portable Document Format (PDF); the latest version of Adobe Reader or similar software is required to view it. Download the latest version of Adobe Reader, free of charge.