 Study Areas: The labels for the nine surficial aquifer study areas on the index map indicate the key river basin that is named in each publication title, and the date range that applies to each of the nine sets of water-level measurements/water-table contour interpretations. Note that the Upper Maurice River study area was the first of the series (1986), and the extent of three subsequent studies (Great Egg Harbor River, Salem River, and Maurice River) overlap this earliest study area. The nine surficial aquifer studies in the NJ Coastal Plain were done in cooperation with the New Jersey Department of Environmental Protection in order to provide a scientific basis to help address environmental, water-resource management and planning, water availability, water use, and water quality questions.
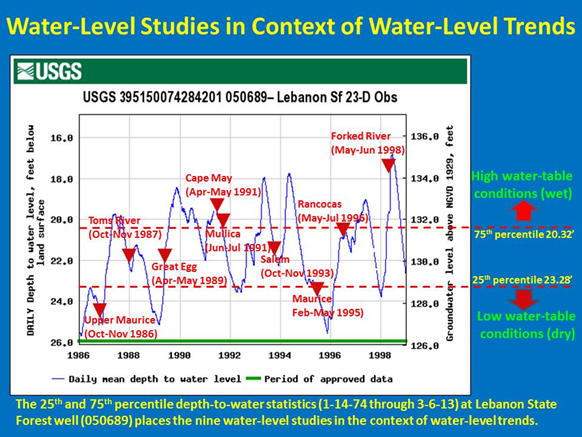
The water level data and interpretive water-level contours in this web viewer are presented here to provide insight into the depth to water, altitude of the water table, water-table gradient, and direction of groundwater flow within the unconfined aquifer system . It is important to note that the water-levels and contour interpretations are specific to the period of measurement for each study, as indicated by the interval of months listed with each study area label. The figure below uses one observation well to illustrate the approximate differences/trends in water-table conditions among the different time periods (fall or spring, 1986-1998) for the nine surficial aquifer studies. In addition to differences in water-table conditions and historical trends, changes in local or regional withdrawals can also complicate comparisons. For all these reasons, caution must be exercised when applying this historical water-level information to any other time period, including current conditions, and any comparison should only be considered an approximation.
The surficial aquifer study information presented through this web-viewer is limited to water-level information and is in the form of geographic data layers. Other information presented as part of the surficial aquifer studies is not available in geographic data layer form but can be downloaded in pdf format as the complete original reports (https://nj.usgs.gov/programs/Surficial/). The range of other information from the original surficial aquifer study publications includes presentation of; land use, population data, water-use, surficial geology, precipitation, evapotranspiration, and hydraulic properties of the surficial aquifer. Streamflow-related information includes stream discharge data (statistics on mean discharge and base flow), flow duration curves, and low-flow correlations. Water-quality data is presented for both groundwater and surface-water sites, and a regional comprehensive water budget are also presented. More information about the surficial aquifer studies can be found at https://nj.usgs.gov/programs/Surficial/
 Study Area Boundaries: The study area boundaries were delineated in cooperation with the New Jersey Department of Environmental Protection for their purpose of developing a scientific basis to help address water-resource management questions. In most cases, the study area boundaries coincide with the outlines of major surface-water drainage basins. Links to data explanations (metadata) and downloadable data for each of the study area boundaries can be found at https://nj.usgs.gov/programs/Surficial/.
 Geologic Units: The map of underlying geologic units presented here serves only as general guide to the nature of the lithology underlying the study areas. In some cases the boundaries of geologic units do not directly correlate to similarly-named hydrogeologic units. The mapping of water levels in the water-table systems of New Jersey did not differentiate between geologic material that is considered an aquifer or a non-aquifer (confining unit). Links to data explanations (metadata) and downloadable data for the geologic units can be found at https://www.state.nj.us/dep/njgs/geodata/dgs04-6.html. Reference: Bedrock Geologic Map of Central and Southern New Jersey, Owens, James P., Sugarman, Peter J., Sohl, Norman F., Parker, Ronald A., Houghton, Hugh F., Volkert, Richard A., Drake, Avery A., Jr., and Orndorff, Randall C., 1998. Scale 1 to 100,000, 8 cross sections, 4 sheets, each size 58x41, I-2540-B
 Red-filled circle: Location of select groundwater wells, from which water levels were measured specifically for each project, and used along with stream-water level measurements, to provide control for construction of a water-table contour map. In addition to being strategically located, wells were selected that were relatively shallow (typically screened less than 150 feet deep) in order to represent shallow (unconfined) groundwater levels. The selected wells were either already existing in USGS’s National Water Information Site database (NWIS), or were selected in the field and then later entered into the NWIS database. Links to data explanations (metadata) and downloadable data (including well construction and related measurement information) for the projects' groundwater wells can be found at https://nj.usgs.gov/programs/Surficial/.
 Black-filled triangles: Location of select stream and surface-water sites, from which water levels were measured specifically for each project, and used along with groundwater-level measurements, to provide control for construction of a water-table contour map. Water-level measurement sites were selected where a culvert, bridge, or concrete berm provided ready accessibility and a reference point, and especially where there was a lack of other water-level control points. In upstream areas, an effort was made to bracket measurement points between a dry point and a flowing point, thus indicating a stream interval in which start-of-flow can be inferred. Links to data explanations (metadata) and downloadable data (including related measurement information) for the projects' stream and surface water sites can be found at https://nj.usgs.gov/programs/Surficial/.
 Water-level contour lines: Contour lines represent interpretations of equal water-table altitude, and are based on the set of water levels measured from strategically selected wells, streams, and surface-water sites (lakes, ponds). The contour lines are each author’s hand-drawn interpretation of the approximate water-table surface during the time interval of the water measurements. Each study areas’ set of contour lines are of a different arbitrary color in order to highlight that the water levels represent distinct studies; different time periods and different author’s interpretations. The figure above (Water-Level Studies in Context of Water-Level Trends) illustrates the range of seasonal water-table conditions over which the studies occurred. Note that along study area borders, contour lines commonly overlap with contours lines in neighboring study areas, in some cases indicate a substantial difference in seasonal water-table conditions between the studies and or in the author’s interpretation. Links to data explanations (metadata) and downloadable data for the projects' water-level contour lines can be found at https://nj.usgs.gov/programs/Surficial/.
 Black-filled circle: Groundwater wells with daily water-level values, from USGS's National Water Information System database (NWIS). These wells were typically also used as part of the specific water-level study project and were included here because, in addition to for the project, they can provide additional and often more recent water-level information for the unconfined aquifer system. Caution should be used with these unconfined wells because fine-grained layers (clay, silt) could be present and might make a specific well less representative of water-table conditions than other wells. The user is encouraged to consider site-specific information where it is relevant to their purpose. More information about USGS's groundwater-level data in New Jersey can be found at
https://nwis.waterdata.usgs.gov/nj/nwis/gwlevels/.
Black-filled circle: Groundwater wells with daily water-level values, from USGS's National Water Information System database (NWIS). These wells were typically also used as part of the specific water-level study project and were included here because, in addition to for the project, they can provide additional and often more recent water-level information for the unconfined aquifer system. Caution should be used with these unconfined wells because fine-grained layers (clay, silt) could be present and might make a specific well less representative of water-table conditions than other wells. The user is encouraged to consider site-specific information where it is relevant to their purpose. More information about USGS's groundwater-level data in New Jersey can be found at
https://nwis.waterdata.usgs.gov/nj/nwis/gwlevels/.
 Non-filled/white-bordered circle: Groundwater wells from USGS's National Water Information System database (NWIS) that have water-level values but not daily water-level values. These wells were not a part of the water-level measurement projects but were selected because they are classified as unconfined and can provide additional, and often more recent water-level information for the unconfined aquifer system. Caution should be used with these unconfined wells because fine-grained layers (clay, silt) could be present and might make a specific well less representative of water-table conditions than other wells. The user is encouraged to consider site-specific information where it is relevant to their purpose. More information about USGS's groundwater-level data in New Jersey can be found at https://nwis.waterdata.usgs.gov/nj/nwis/gwlevels/.
Using this site
This interactive web-viewer tool enables convenient online viewing of water level information and water-level contour interpretations for published studies of the unconfined aquifer system in southern New Jersey.
INFORMATION AT THE OVERVIEW LEVEL:

“Explanation” shows the shaded study areas that you could turn on/off by the “check”,

and then turn on the geology by “checking” it.

Or you could select a study area (Mullica) for display, with the underlying geology.

For Mullica study area, we can turn off the geology and just the basemap “satellite imagery”, shows up.
TWO OTHER BASEMAP OPTIONS:

a basemap of the “topographic” map, or

a basemap of a “street” map.
BASIC NAVIGATION TOOLS:

The palette in the upper right corner of the screen allows selection of a "zoom-in area", a "zoom-out area", a pan (hand), a totally zoomed-out view of the entire area, and arrows to go to the "previous" view, or the "next" view in the sequence you've been working within.

In the upper left corner is a "+" and a "-" tab that allows stepwise zooming in, or zooming out.
One can also double-click at any view to zoom in one step, between zoom levels 1 to 15.

A scale bar, longitude-latiude value (decimal degrees), and “Current zoom level” ( 1 to 15) are provided in all views, in the lower left corner of the map.
APPROACHES TO NAVIGATING TO AN AREA:
1) Pan to an area and zoom in progressively, re-panning as needed. Or

2) Do a "place search", by clicking on the “Search” tab on the upper right, and type in, for example, “Laurel Lake NJ”, or

a "street address search", for example “732 N Delsea Dr Clayton NJ”, or

an "intersection search", for example “Maple St & N Delsea Dr Clayton NJ”,
Note that when you zoom in some layers (shaded study area limits, geology) will disappear, by design.
GROUNDWATER POINT INFORMATION FROM THE STUDY (red-filled circle):


Two panels of informational pop-ups can be accessed by clicking on a study’s groundwater point (red-filled circle). Note that the “Study Area” pop-ups contain links to USGS, New Jersey Water Science Center’s Surficial Aquifer Studies web-page, where you can download the original report (pdf), the metadata, and the geographic/data layers.
STREAM/SURFACE-WATER POINT INFORMATION FROM THE STUDY (black-filled triangle):


Two panels of informational pop-ups can be accessed by clicking on a study’s stream/surface water point (black-filled triangle). Note that the “Study Area” pop-ups contain links to USGS, New Jersey Water Science Center’s Surficial Aquifer Studies web-page, where you can download the original report (pdf), the metadata, and the geographic/data layers.
WATER-LEVEL CONTOUR LINES (various-colored labeled lines, altitude in feet):

There are no pop-ups specifically for contour lines: Clicking on a contour line brings up a “Study Area” pop-up to USGS’s New Jersey Water Science Center Surficial Aquifer Studies web-page, where you can download the original report (pdf), and the metadata and geographic/data layer for the contour lines.
GROUNDWATER POINT INFORMATION FROM NWIS wells, with daily water-level values (Black-filled circle):


Three panels of informational pop-ups can be accessed by clicking on an NWIS daily groundwater-level point, which typically have also been used as a groundwater point for the project. Note that the “Study Area” pop-ups contain links to USGS, New Jersey Water Science Center’s Surficial Aquifer Studies web-page, where you can download the original report (pdf), the metadata, and the geographic/data layers. The panel for “NWIS Site” information contains a link to the daily-water-level values and related well information.
GROUNDWATER POINT INFORMATION FROM NWIS wells, not daily water-level values (Non-filled/white-bordered circle):


Note that the “Study Area” pop-ups contain links to USGS, New Jersey Water Science Center’s Surficial Aquifer Studies web-page, where you can download the original report (pdf), the metadata, and the geographic/data layers. The panel for “NWIS Site” information contains a link to the non-daily-water-level values and related well information.