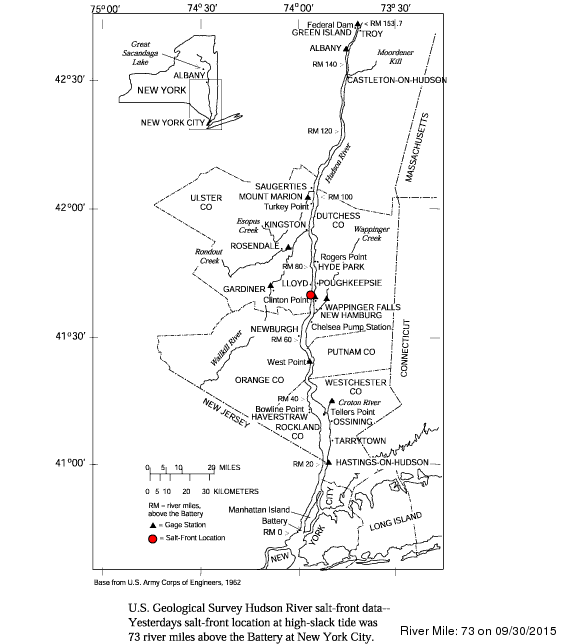
Hudson River Salt-Front Data
Tide stage, specific conductance, water temperature, and freshwater inflow at selected Hudson River (New York) gages updated every hour. Water temperature and specific conductance are measured at a depth of 10 feet below NGVD 1929 (mean sea level). These data include PROVISIONAL DATA subject to revision.
This information has been made possible by funding from the U.S. Geological Survey Cooperative Water Program and National Streamflow Information Program and New York City Department of Environmental Protection, New York State Department of Environmental Conservation, New York State Department of Health, Hudson Valley Regional Council (representing Dutchess, Orange, Putnam, Rockland, Ulster, and Westchester Counties), the Hudson River-Black River Regulating District, and the City of Poughkeepsie, NY.
| Estuary Conditions | Streamflows | Forecasts | Historical Events | Project Description and Reports |
Hudson River Estuary:
- Current salt-front location in the Hudson River (map, table, tab delimitted).
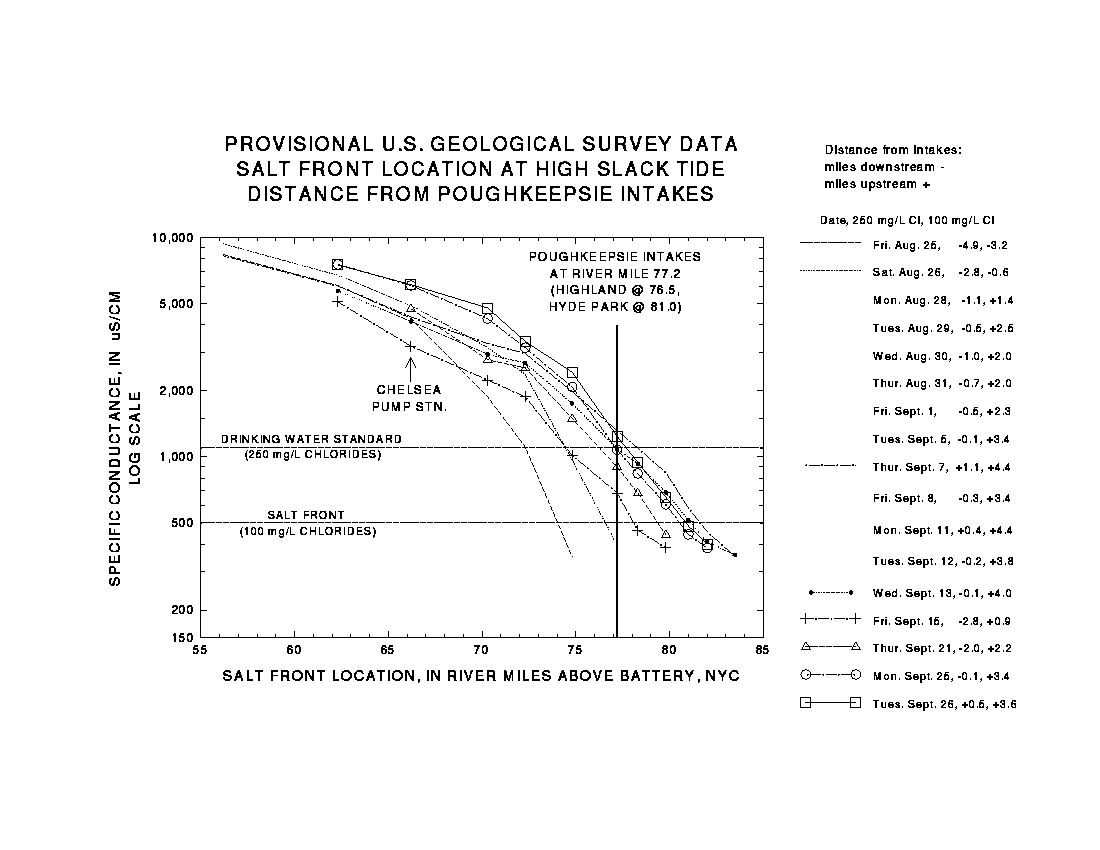
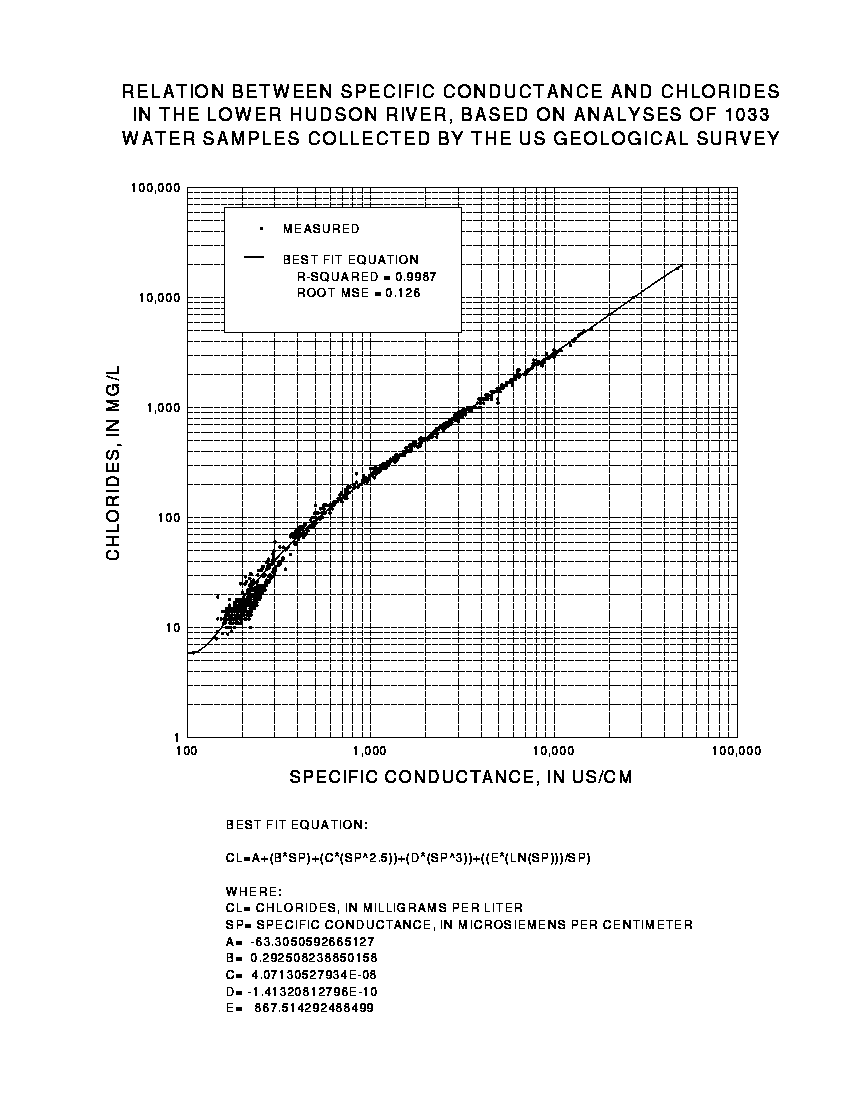
Location, in river miles above The Battery, New York City, is a daily value for the most upstream location (at high slack tide) for the previous day. The salt front is defined as 100 mg/L chloride concentration; and measured in the field as a specific conductance of 510 microsiemens per centimeter at 25 degrees Celsius (see conversion chart).
- Historical daily salt-front location in the Hudson River for the period of record, 1991 to current water year (tab delimitted, scatter-plot jpg).
- Current conditions table for all USGS Hudson River salt-front gages
- Gage at The Battery, New York City (NOAA/NOS/CO-OPS water level station):
- Gage at Piermont:
- Gage at West Pt. South Dock:
- Gage below Poughkeepsie:
- Gage at Albany:
- TABLE of Daily Values at selected USGS gages
Streamflows and Reservoir Levels:
- Streamflow gages (15-minute discharge plots; default period 7 days; 120 days on-line) at:
- Hudson River below Lock 1 near Waterford, NY (Stn# 01335755)
- Mohawk River at Cohoes, NY (Stn# 01357500)
- Sacandaga River at Stewarts Bridge, near Hadley, NY (Stn# 01325000)
- Hudson River at Hadley, NY (Stn# 01318500)
- Rondout Creek at Rosendale, NY (Stn# 01367500)
- Wallkill River at Gardiner, NY (Stn# 01371500)
- Wappinger Creek near Wappinger Falls, NY (Stn# 01372500)
- Great Sacandaga Lake at Conklingville, NY (Stn# 01323500):
- New York City reservoir levels
- All Gages in New York:
Forecast:
- NWS Quantitative Precipitation Forecast:
- Other links for meteorologic and oceanic conditions and astronomical data
Historical Event Information:
- Summer 2002 Drought
- Daily stats with WY2003
- Daily stats with WY2003 and WY2002
- Daily stats with WY2003, WY2002, and WY1995
- Monthly stats with WY2003 and WY2001
- Monthly stats for period of record
- Daily mean for period of record
- West Pt conductance CY2002 & CY1995
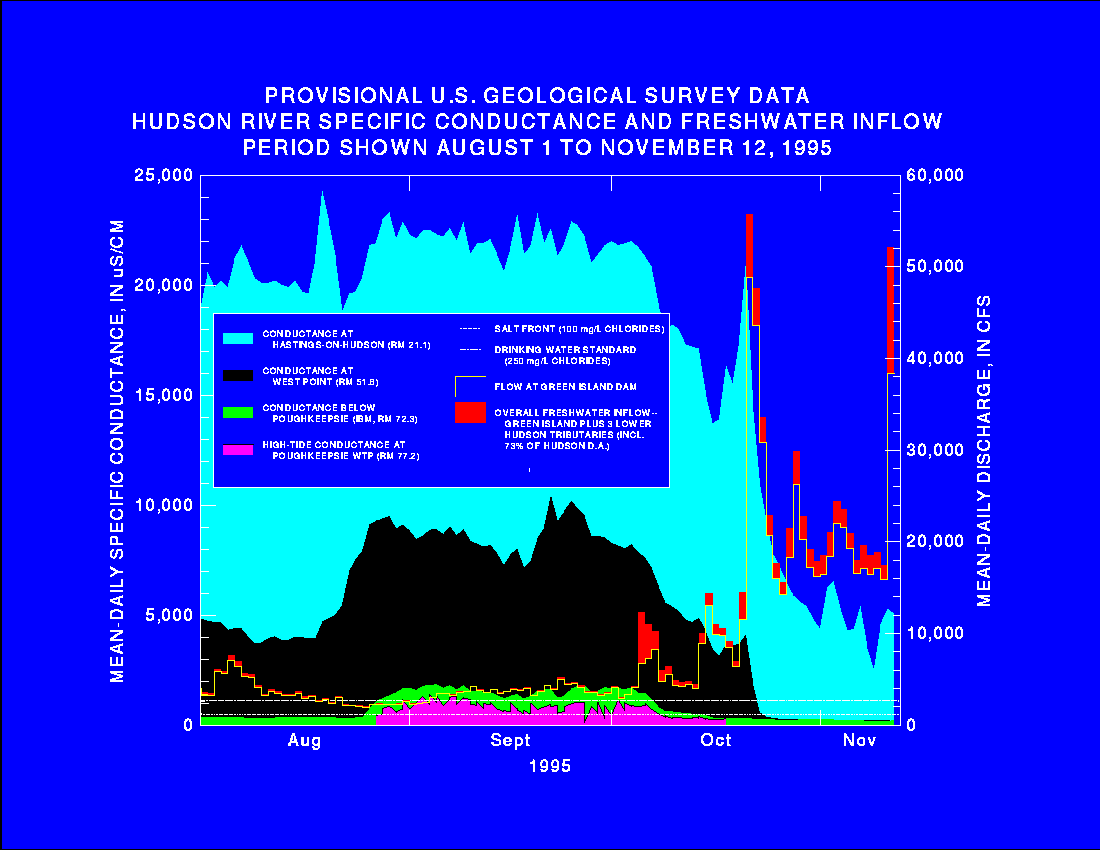
- Summer 1995 Drought
- Hudson River Salt-Front Delineations:
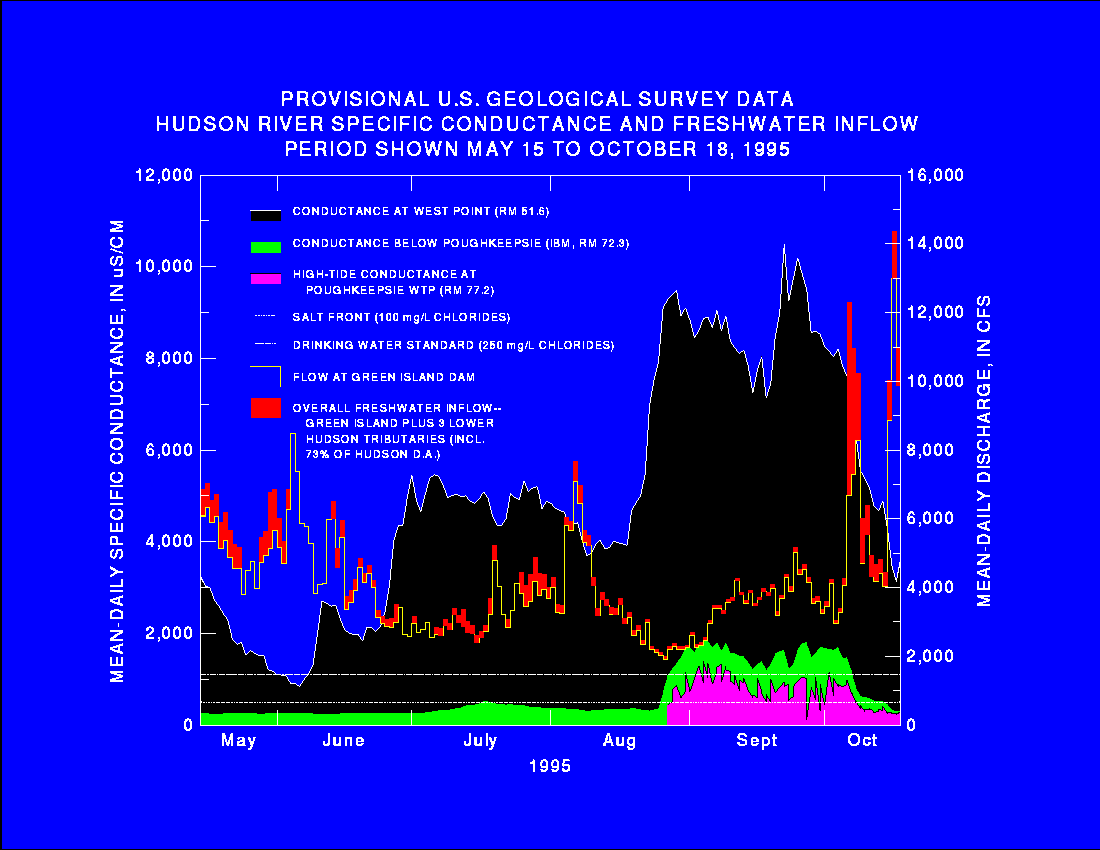
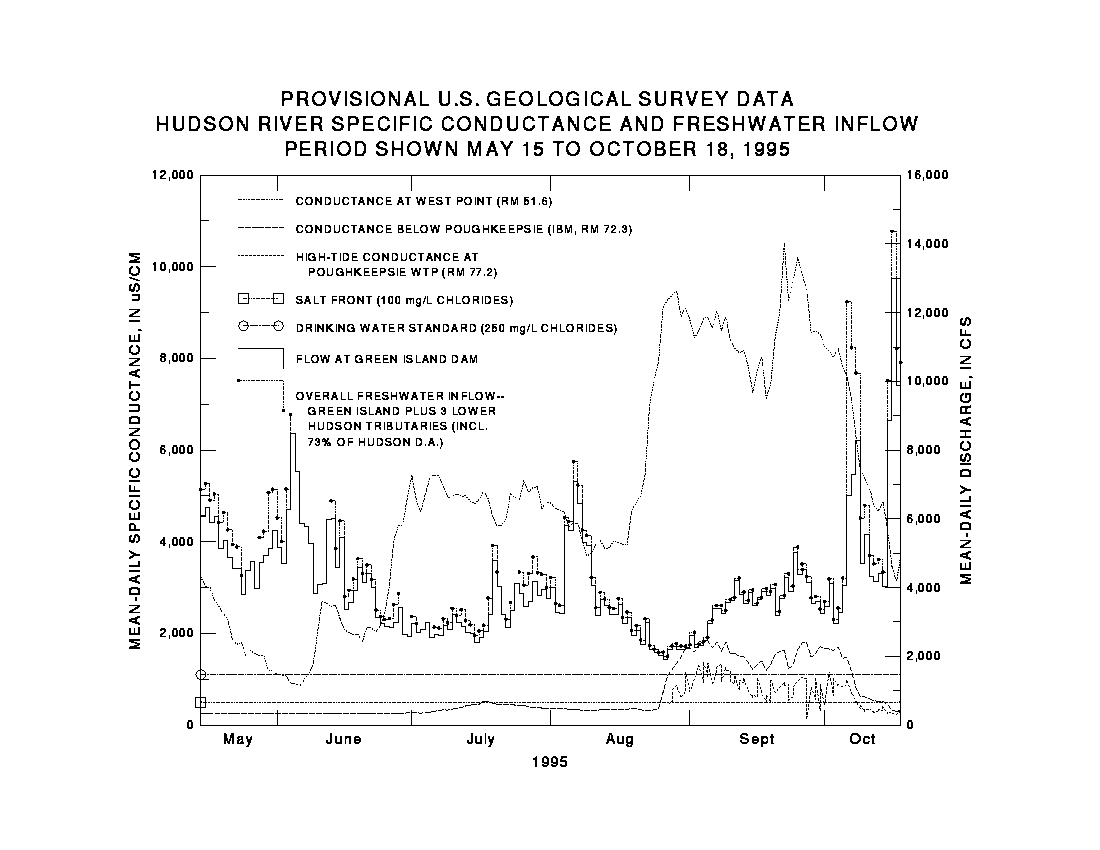
- Hudson River Specific Conductance and Tributary Inflow:
- Historical monthly freshwater flow data for Hudson River at:
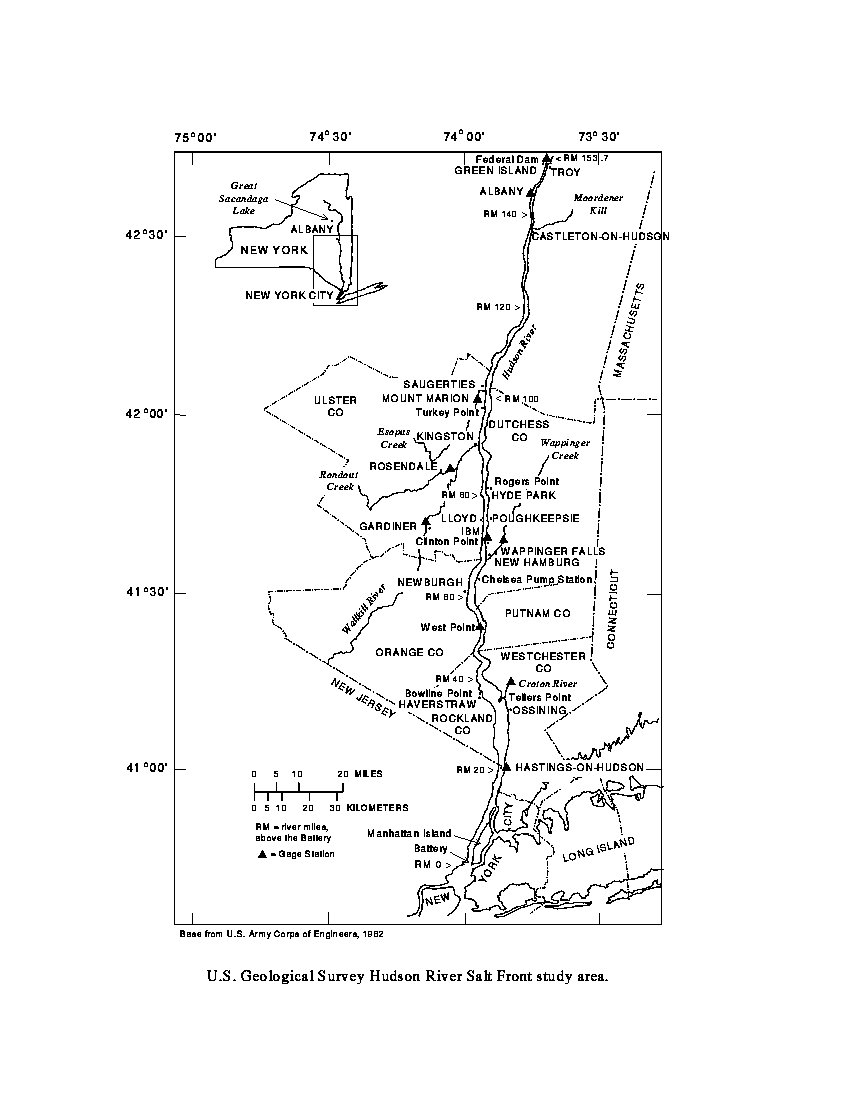
USGS Hudson River Salt-Front Study (Project Description, Map, etc.):
- Project description of USGS Hudson River Salt-Front Study
- Map of study area showing gage locations for USGS Hudson River Salt-Front Study (hsfmap1.gif 20k, hsfmap1.ps 164k)
- Report titled "Salt-Front Movement in the Hudson River Estuary, New York--Simulations by One-Dimensional Flow and Solute-Transport Models" by M. Peter de Vries and Lawrence A. Weiss
- Conference paper titled "Flow and Chloride Transport in the Tidal Hudson River, NY" by Lawrence A. Weiss, Raymond W. Schaffranek, and M. Peter de Vries (hudrpt16.pdf 77k)
- Conversion chart showing relation between specific conductance and chlorides in the lower Hudson River (spcn2cl.gif 26k, spcn2cl.ps 482k)
- Bathymetry data from report "Cross Sections of the Hudson River Estuary from Troy to New York City, New York" by David A. Stedfast -- CGAP data file description, CGAP data file for river mile 21 to 49 (Hastings-on-Hudson to West Point), CGAP data file for river mile 51 to 153 (West Point to Troy).
-
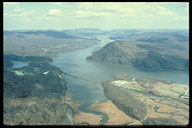
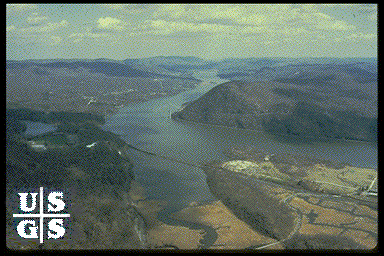
Photograph of Hudson River looking north toward Bear Mtn. Bridge (located on
map at point where Putnam,
Rockland, and Westchester Counties meet) and West Point. In foreground is Doodletown Bight and
Salisbury Meadow; Iona Island is at right
(hudriver.gif 39k).
IE browsers only-->Other photographs include commercial ship traffic, tidal wetland across from West Point, aerial view of Croton Point, salt-front monitoring gages, meteorologic, specific conductance and tide-stage measuring equipment, leveling in gages to a common datum,
acoustic Doppler current profiling equipment (ADCP) used for discharge measurements, and ADCP current profiles showing bi-directional flow in a Hudson River cross-section.